
Trading Rule #22 – Is Trading Homework Just For Children?
Nobody likes doing homework.
I once came close to flunking a 2 year college course because I missed 5 out of 8 pieces of coursework in the 'Quantitative Methods' module (yes, as dull as it sounds). The teacher pulled me aside and said I'd flunk the entire course if I didn't complete them unless I got "a miracle" in the exam. As a 17 year old idiot, I said "tell me about this miracle option" . She just threw her hands up in exasperation.
What she said was "get off your ass". What I heard was "there's a high risk way to escape torture.". I have ADHD - which didn't exist then, so she really didn't understand the torture side.
Anyway - that's what I did. I got 93% in the exam, which on average still put me at the top of the class for that topic and the course and in fact the year. Teachers were NOT impressed.
So, what about market homework?
Should you prepare to trade each morning, or should you focus 100% on the charts?
Well - ask me to prep once and I'll prep. Ask me to prep twice and I'll prep. Ask me to prep a 3rd time and I'll automate the whole process.
Partially laziness, partially greed.
Charts are finite, in that they show a tiny subset of what's going on. They don't tell us anything about why moves are happening, just what happened. For most - the sum total of infomation used is open, close, high, low and volume - at whatever periodicity you are convinced is "the one".
That is 5 data points repeated over and over again and again and again and again.
None of them help if Iran bombs a Saudi refinery.
Some traders see:
- Saudi refinery bombed (oil up, corn up)
- Saudi Prince says the refinery will be online in 2 weeks (oil down, corn down)
- Iran threatens other refineries (oil up, corn up)
But the "chart only" trader this is what they say
- Big Green Candle
- Big Red Candle
- Big Green Candle
No context, no undersanding of macro relationships - but more importantly, you learnt nothing. You weren't in the loop on the cause of the move. You are just playing space-invaders with red and green candles.
Here's the Jigsaw Market Intelligence Edge new from 27th August, 2026 - can you tell which market/instrument each one represents?
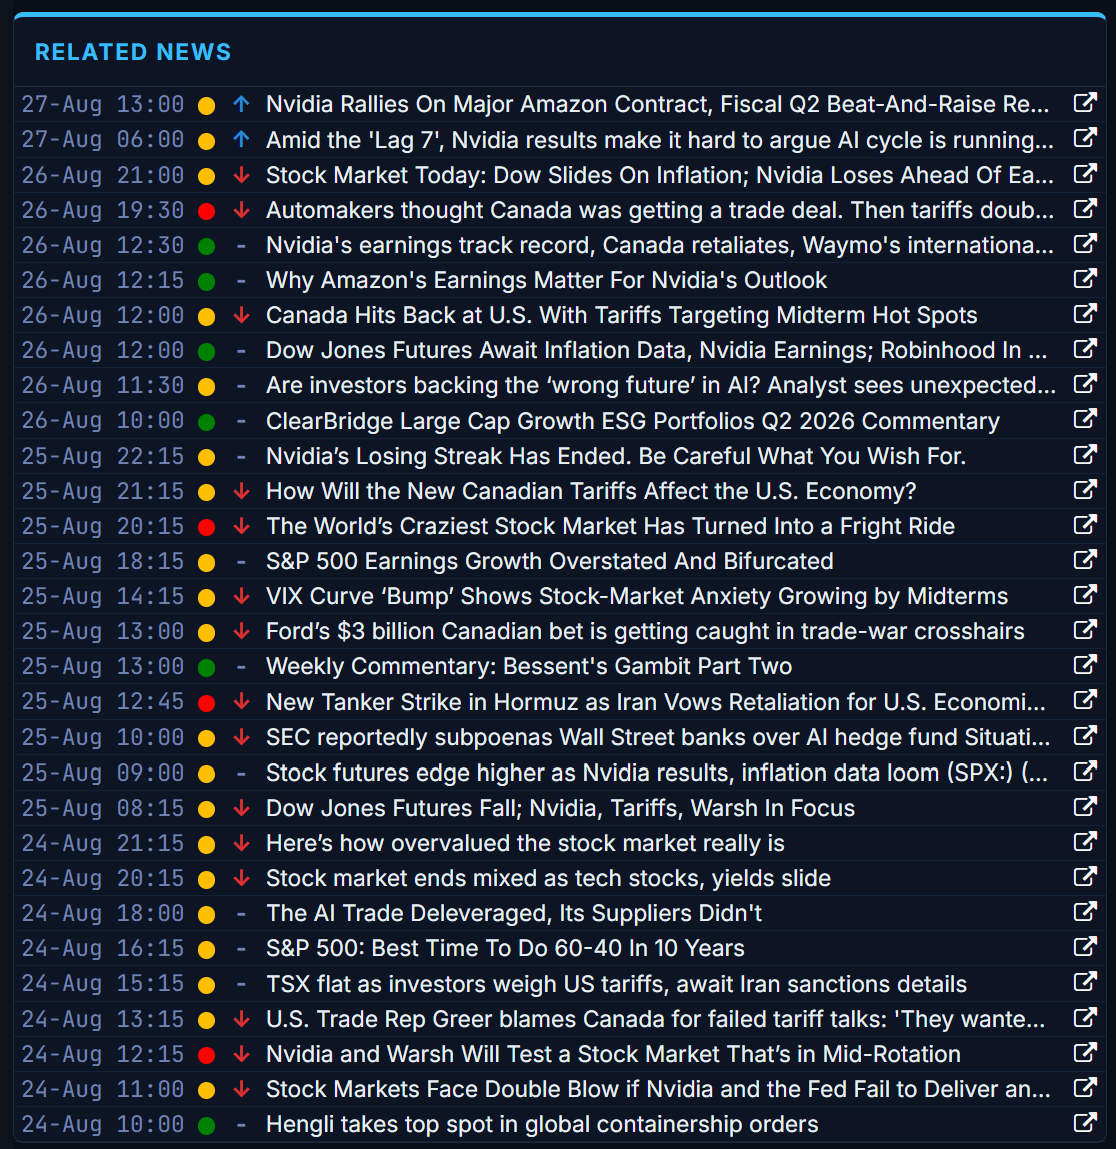
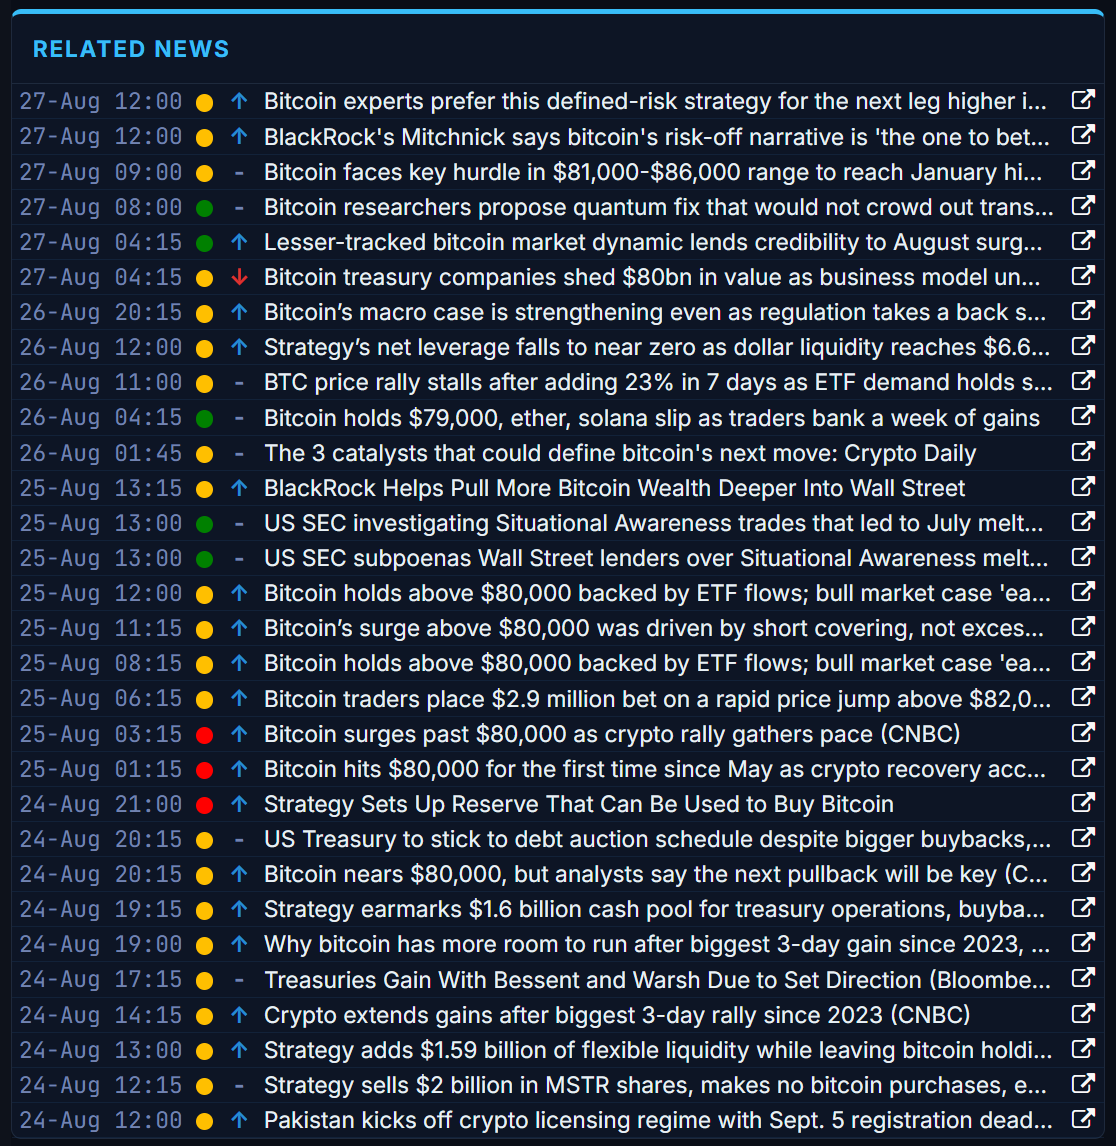
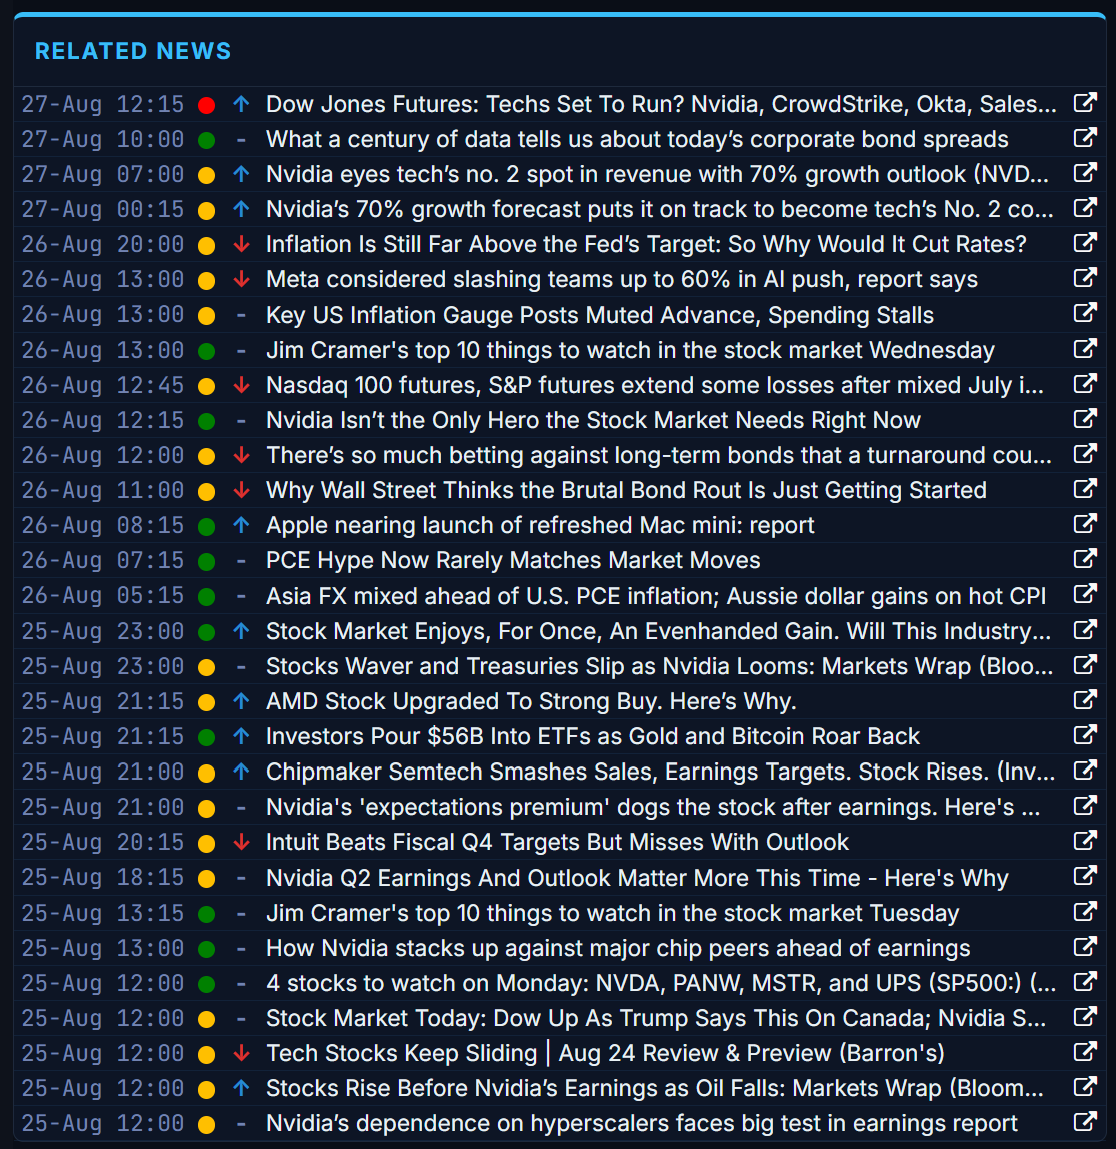
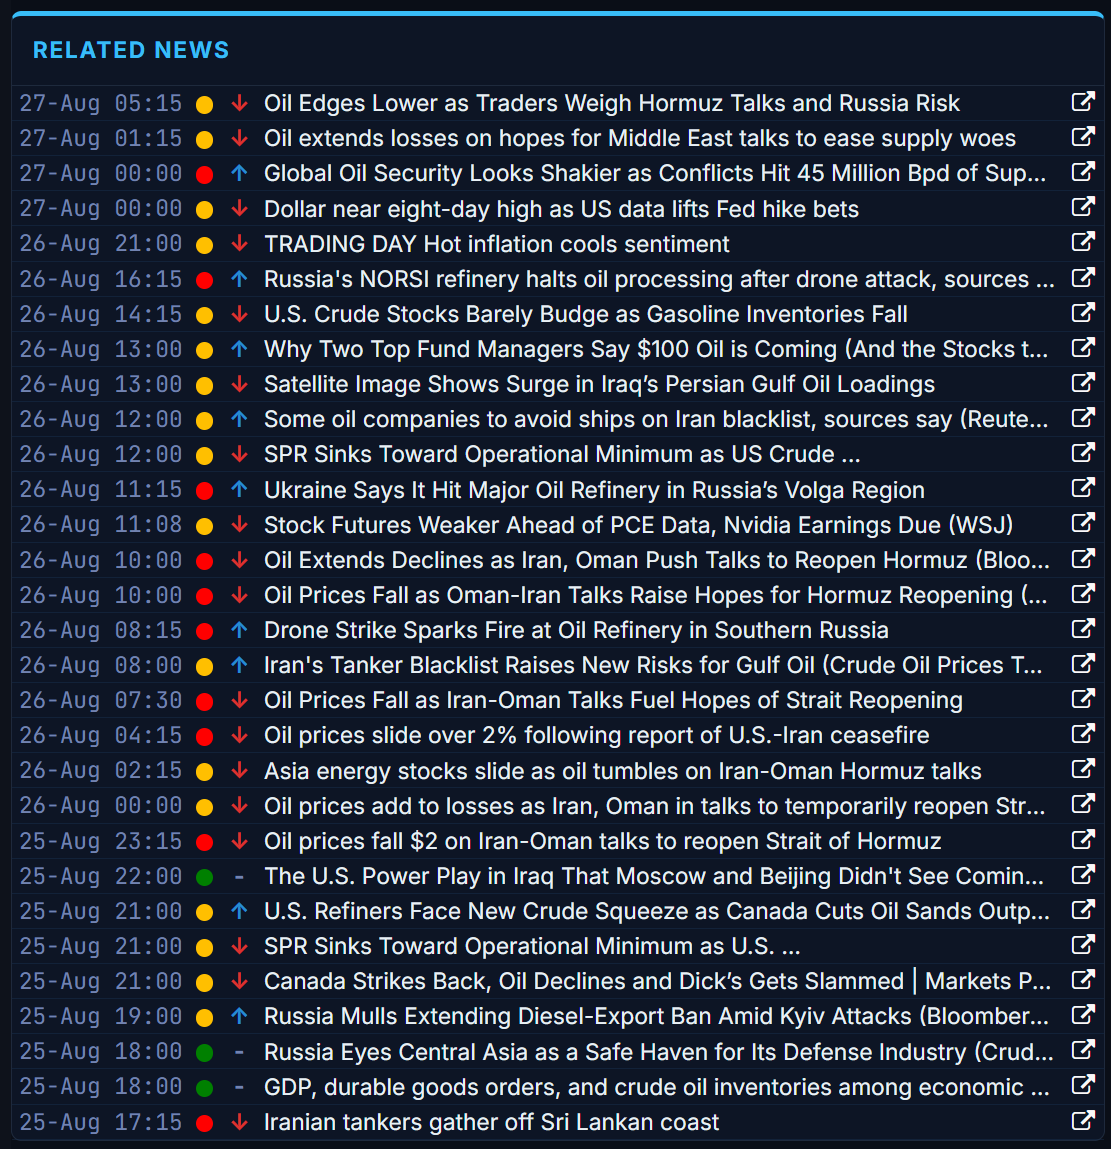
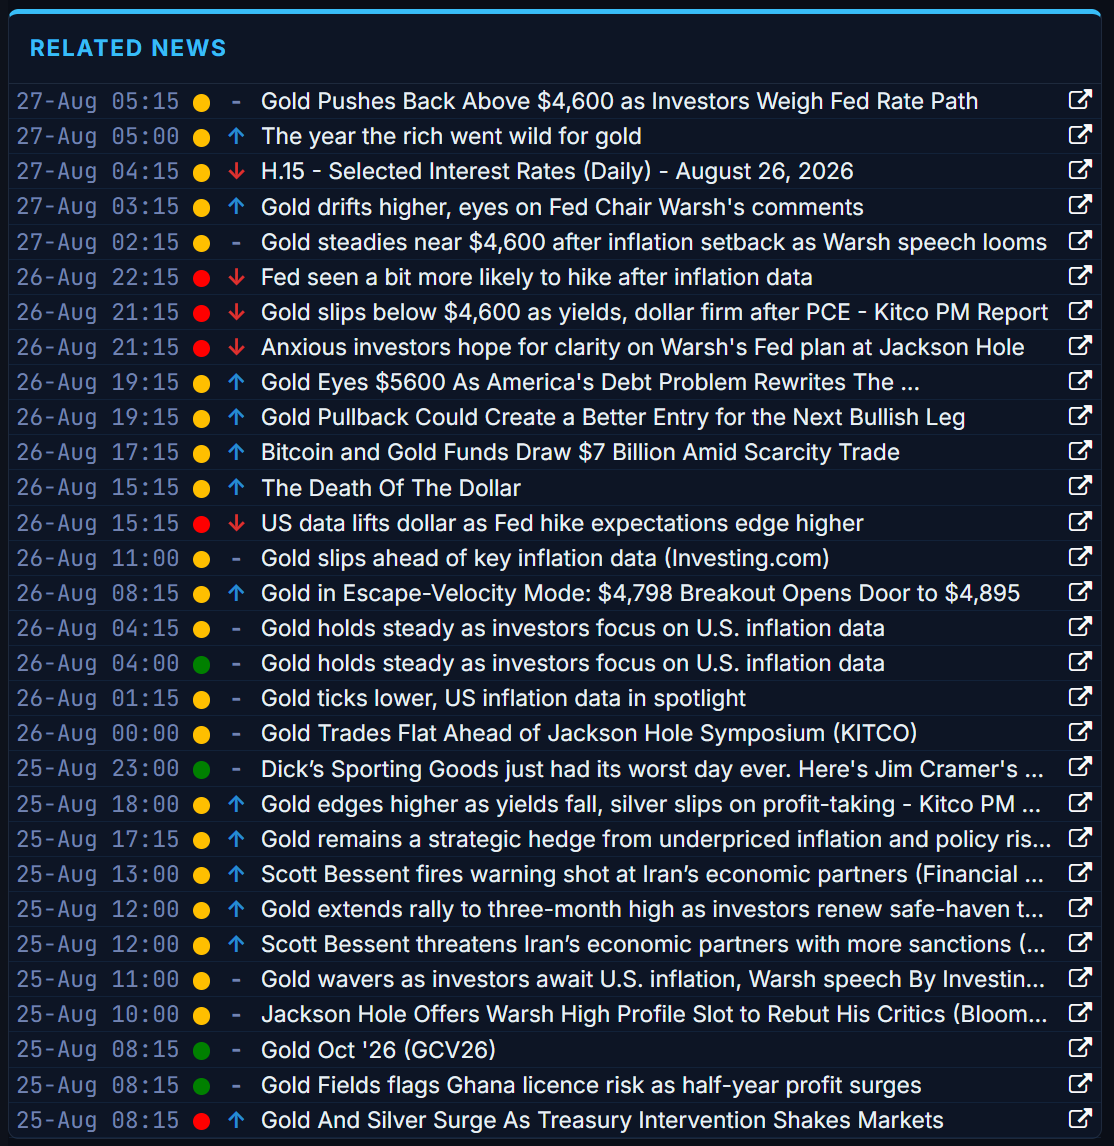
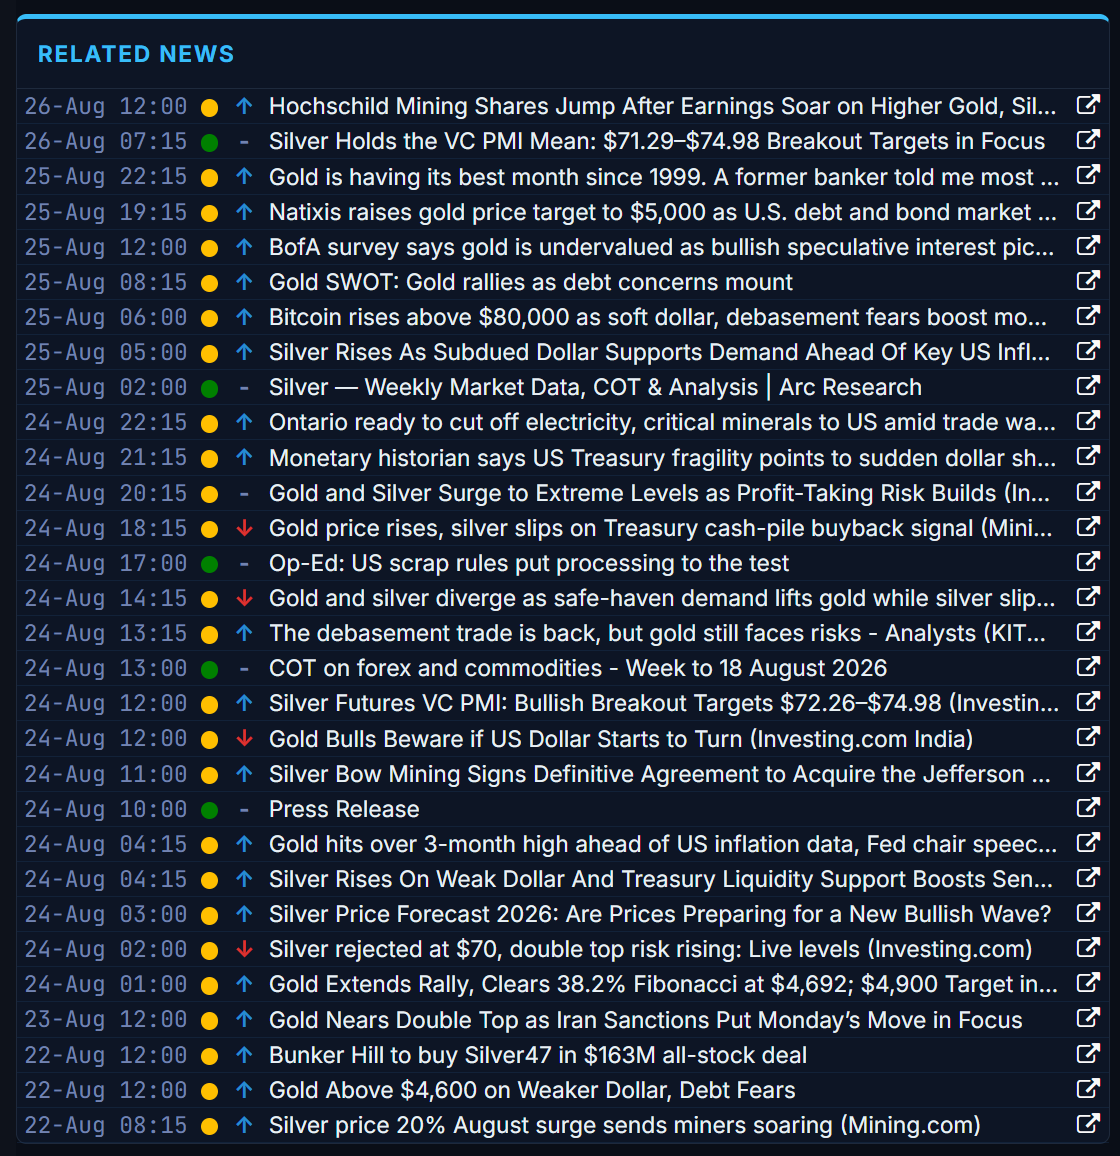
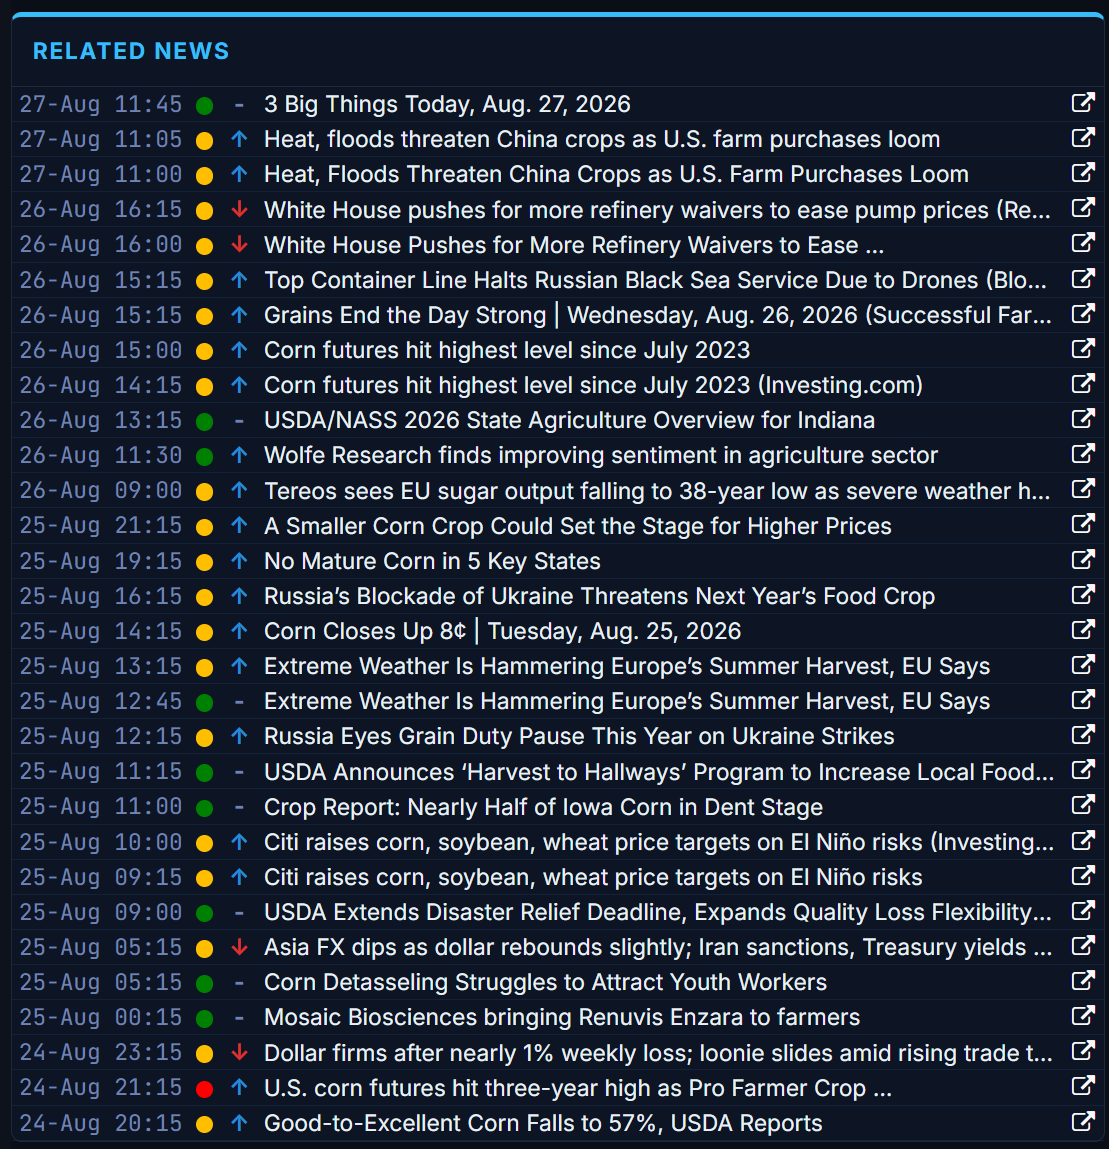
Now - look again - these aren't just financial headlines, they are curated headlines, the global news for your instrument. Stuff that impacts your market & how much that impact will be.
The red and blue arrows indicate the SENTIMENT of the news - is it bullish or bearish for that market? And it's also been ranked for IMPACT - with red being the most impactful for that market and green being the least.
So, you can employ a Junior Analyst with a Finance/Economics degree to tell you what's driving the markets, you could spend a few hours doing it yourself OR - use a tool like Jigsaw Market Intelligence and get it in minutes.
But the tool is not the key here. The point is that you'll trade better if you have an idea of what's going on. Lines on the chart do not represent big Gold finds, new Oil Fields, supply shortages, inflation etc. etc. etc.
With Market Intelligence - you don't just get the news, you get the news interpreted for impact. Not because you will need that interpretation in 6 months - but so you learn the relationships between events and markets over time by living and breathing them.
Charts tell you what traders did. News/context tells you why they may have done it. Without the why, you’re just naming candles after the fact.