Jigsaw Trading Blog

Relative Volume & Average Tick

I’ve been getting a lot of requests about how I set up 2 of the charts I show in Jigsaw Webinars.

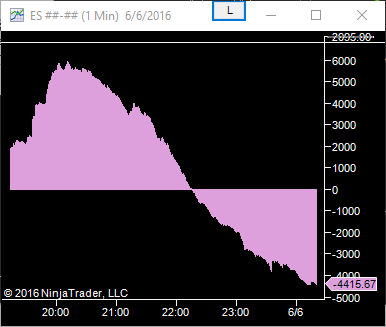
CSI (Cumulative Sheep Index) aka Relative Volume

This shows volume at the time of day relative to the prior n days. In my case, I look back 60 days. In the above image, we can see that we are now 4415 contracts below the 60 day average for the time of day. This is very useful in terms of identifying when volume is picking up or slowing down. The absolute value is not as important as whether it is rising or falling.   As participation changes, the price action changes too. In my opinion, this is one of the best ways to analyze volume/participation in the markets.

Relative Volume


Average TICK  (TICK Tamer)

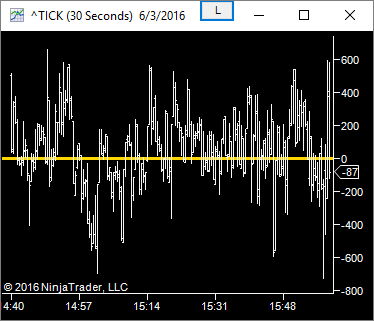
This is based on the NYSE Tick, which in turn is based on how many of the stocks on the NYSE are ticking up vs down. It’s really just a way to look at what the overall stock market is doing.

The TICK looks like this:

TICK


It’s not the easiest thing to read, hence needing to tame it and that is what the TICK Tamer does. It takes an average of the values for each bar (there’s no lag as it doesn’t use history) and that results in either a positive or negative value. Positive values mean overall stocks are ticking up and negative that they are ticking down:

Average Tick


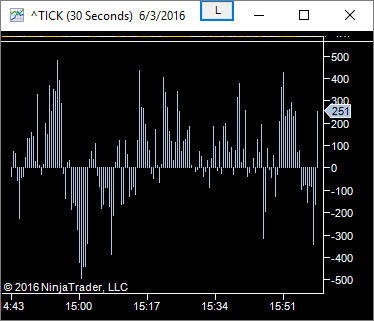
There’s no ambiguity when you take an average of the TICK. So it’s easy to eyeball whether the day is mixed or one sided. If you are long and it starts taking a massive spike down, your trade may be in peril.

The indicator code for NinjaTrader 7 is attached. If someone has the time to produce these for other platforms and you want to share them, let me know.

Note that I am sharing these here but please do not share them on line without asking first.

Indicators – Manual Install

Download the files to (My) Documents\NinjaTrader 7\bin\Custom\Indicator Then restart Ninja. The indicator names are DTAverageTickIndex and JTRelativeVolume

Average Tick

Relative Volume

Indicators – NinjaTrader export file (Use NinjaTrader import to install)

Jigsaw Indicators – Import File

Chart Templates (move to documents\NinjaTrader 7\templates\Chart)

TICK Tamer Chart Template

Relative Volume Chart Template


Simplify Your Trading

Take a look into the decision making process of professional traders with this video training series that helps you make smarter trading decisions.

Read more articles about trading

Understanding the Flat & Cancel Processes

Understanding the Flat & Cancel Processes

Understanding the Flat & Cancel Processes Published on: August 08, 2022 With markets experiencing extremely high volatility, we feel it necessary to explain the process of Flattening a position or Cancelling all Orders. Or both! First, let's consider a simple...

Trade Journaling: When Will You Need It?

Trade Journaling: When Will You Need It?

Trade Journaling: When Will You Need It? Published on: March 14, 2022 If there's one thing that almost all traders fail to take care of in their journey it's... themselves! It's really up to you if you want trading to be a series of failures, on the path to profit. Or...

Front Running or Fading Absorption ? Dom Trading Setup That Works

Front Running or Fading Absorption ? Dom Trading Setup That Works

Front Running or Fading Absorption ? Dom Trading Setup That Works Published on: March 07, 2022 A long time ago (OK, 2010), the DOM and Order Flow were barely discussed in trading. Most platforms had a DOM, but they were featureless skeletal creatures with very little...

0 Comments

Submit a Comment

Your email address will not be published. Required fields are marked *

Copyright Jigsaw Trading © 2024

Privacy Policy

Futures and forex trading contains substantial risk and is not for every investor. An investor could potentially lose all or more than the initial investment. Risk capital is money that can be lost without jeopardizing ones’ financial security or life style. Only risk capital should be used for trading and only those with sufficient risk capital should consider trading. Past performance is not necessarily indicative of future results.

Testimonials appearing on this website may not be representative of other clients or customers and is not a guarantee of future performance or success.

Jigsaw Leaderboard
Note that the Jigsaw Leaderboard contains a mixture of SIM/Live Traders. For many traders, you can click by their name to see the trades along with the SIM/Live designation.

The following is a mandatory disclaimer for SIM Trading results:

HYPOTHETICAL PERFORMANCE RESULTS HAVE MANY INHERENT LIMITATIONS, SOME OF WHICH ARE DESCRIBED BELOW. NO REPRESENTATION IS BEING MADE THAT ANY ACCOUNT WILL OR IS LIKELY TO ACHIEVE PROFITS OR LOSSES SIMILAR TO THOSE SHOWN; IN FACT, THERE ARE FREQUENTLY SHARP DIFFERENCES BETWEEN HYPOTHETICAL PERFORMANCE RESULTS AND THE ACTUAL RESULTS SUBSEQUENTLY ACHIEVED BY ANY PARTICULAR TRADING PROGRAM. ONE OF THE LIMITATIONS OF HYPOTHETICAL PERFORMANCE RESULTS IS THAT THEY ARE GENERALLY PREPARED WITH THE BENEFIT OF HINDSIGHT. IN ADDITION, HYPOTHETICAL TRADING DOES NOT INVOLVE FINANCIAL RISK, AND NO HYPOTHETICAL TRADING RECORD CAN COMPLETELY ACCOUNT FOR THE IMPACT OF FINANCIAL RISK OF ACTUAL TRADING. FOR EXAMPLE, THE ABILITY TO WITHSTAND LOSSES OR TO ADHERE TO A PARTICULAR TRADING PROGRAM IN SPITE OF TRADING LOSSES ARE MATERIAL POINTS WHICH CAN ALSO ADVERSELY AFFECT ACTUAL TRADING RESULTS. THERE ARE NUMEROUS OTHER FACTORS RELATED TO THE MARKETS IN GENERAL OR TO THE IMPLEMENTATION OF ANY SPECIFIC TRADING PROGRAM WHICH CANNOT BE FULLY ACCOUNTED FOR IN THE PREPARATION OF HYPOTHETICAL PERFORMANCE RESULTS AND ALL WHICH CAN ADVERSELY AFFECT TRADING RESULTS.