
Strength in Numbers
The ability to gauge the genuine strength of a move in a market has a number of implications. We can assess the strength of a move in one direction against the strength of the last move to decide if a market is reversing or just pulling back. We can also look at a move in more absolute terms. Armed with swing chart and cumulative delta indicators, and also with knowledge of how that specific market generally operates, we can assess if what appears to be a good move in price action terms really has a chance of being sustained.
An understanding of the mechanics of price movement is an important factor in assessing strength.
This is not “why are people buying?” but “why does price move at all?”. Maybe a better question is “why doesn’t a market trade at $80.56 one second, then $10.50 the next, and $90.10 the next second?”. The reason price moves in an orderly fashion is the presence of liquidity, the presence of a seller to buy from or a buyer to sell to. Liquidity is also known as limit orders or bids and offers. The market moves up because the offers above have all been traded. They have been “consumed” by market orders. Buyers need to buy from the next offer up and so price moves.
The consumption of liquidity is one of the keys to assessing strength. Buy-side liquidity exists at the inside bid and below and supports a market. If buy-side liquidity disappears, then the price drops. For a market to move down, sellers must consume that buy-side liquidity. Buy-side liquidity only exists below us, there is no buy-side liquidity above the market price. Limit orders to buy become actionable if they are placed above us and will effectively become buy market orders as soon as they are placed. With no bids above us, when a market moves up, especially a fast-moving market, it moves into an area with no buy-side liquidity. It takes time for that buy-side liquidity to establish itself beneath the new prices. A bit like the wake behind a speedboat, there’s a lack of supporting liquidity behind the move.
Many times, countertrend moves are nothing more than a relative lack of liquidity after a move in one direction.
This “liquidity vacuum” is enough to see prices collapse back momentarily. On a price chart, you will see a countertrend move but the move will not exhibit signs of strength. If you can recognize countertrend moves with that lack of strength, you can capitalize on them.
Traditional price-based indicators of strength are not showing us any indication of participation in a move and that’s what we need to analyze. This will allow us to assess if any swing in price is a pullback (liquidity vacuum), a new move initiating or just a weak move in an overall range-bound market.
If participation is higher, then the volume should be higher. That’s the volume in the move, not necessarily the volume associated with any individual price bars.
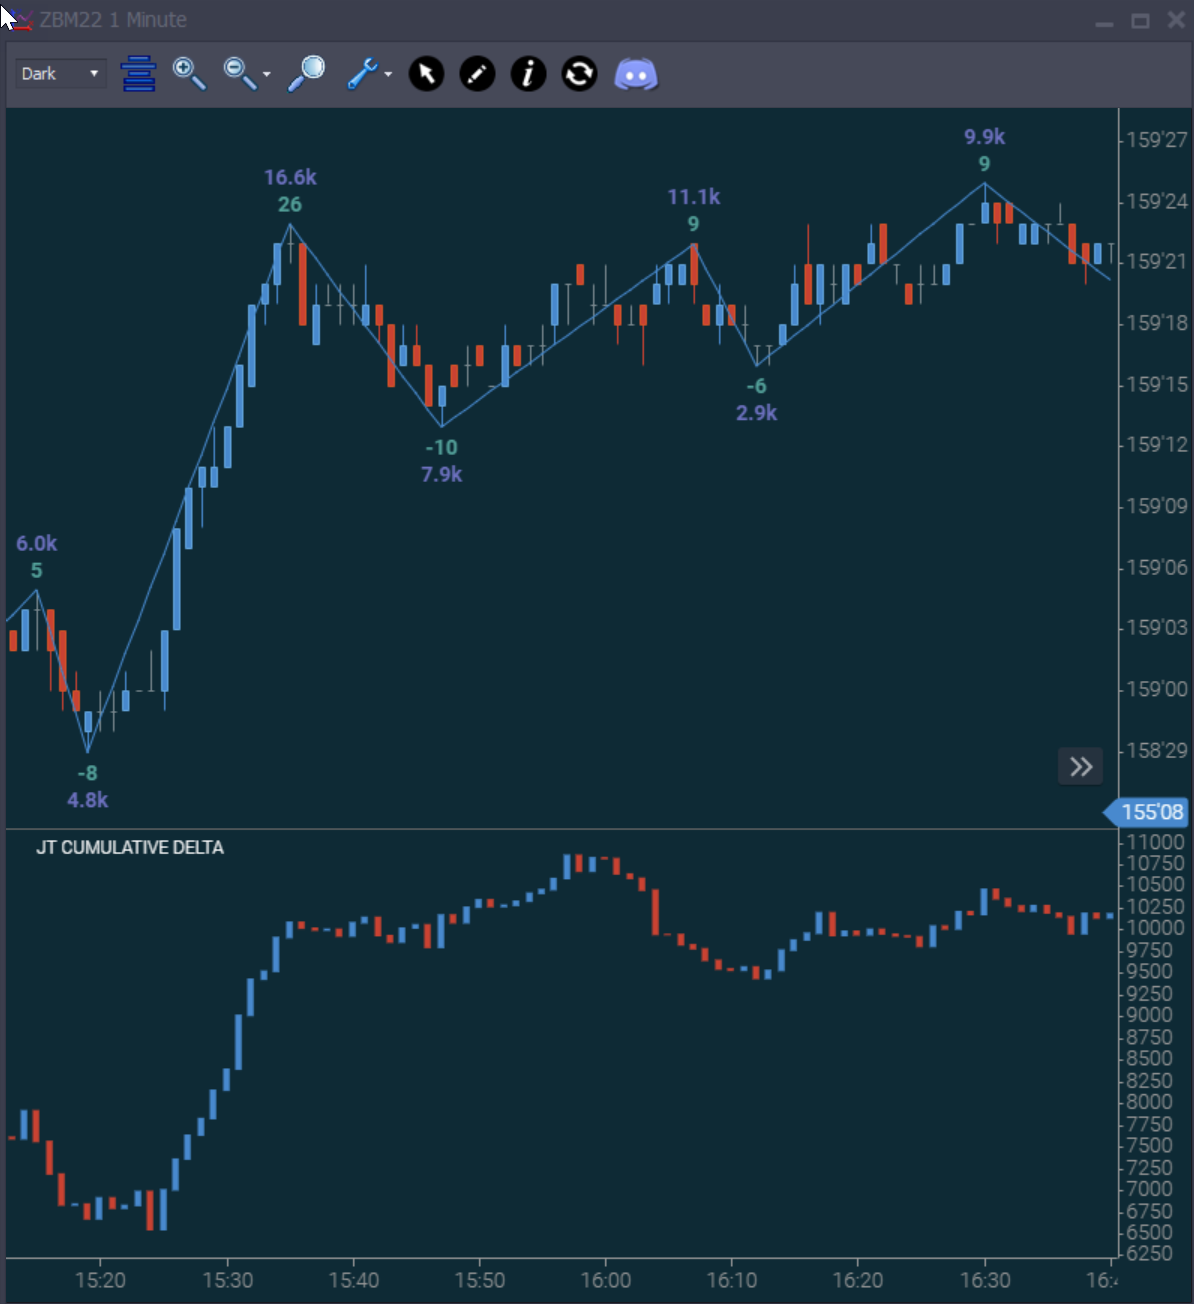
Image 1 – Market moving higher
In this first chart, we can see the volume of each swing on the daytradr Swing Chart indicator (a simple Zig Zag indicator that most platforms have available). The coloring here helps us see where the volume is. An upswing will be blue UNLESS the prior downswing traded more contracts. This is the 30 Year Bond Futures on March 4th, 2022. We see an upswing of 26 ticks, and 16.6 thousand contracts.
Taken on its own this first upswing up is somewhat bullish. After this, the upswings do ‘outsize’ the downswings in volume but not consistently with overwhelming volume, nor are we really gaining ground. This is not indicative of a market where participation is overwhelmingly bullish. We have an initial move with decent participation but there is no follow-through.
On the bottom half of the chart, we have the cumulative delta (buys at market minus sells at market). After that initial first leg, we got a very weak move in the delta, its range is small and it’s not directional. From a delta perspective, there’s no real sign that buyers are out in force. In short, this move does not look like it has the strength to continue upwards. That doesn’t give us a cast-iron guarantee it will reverse but it does tell us to be cautious about trading to the long side.
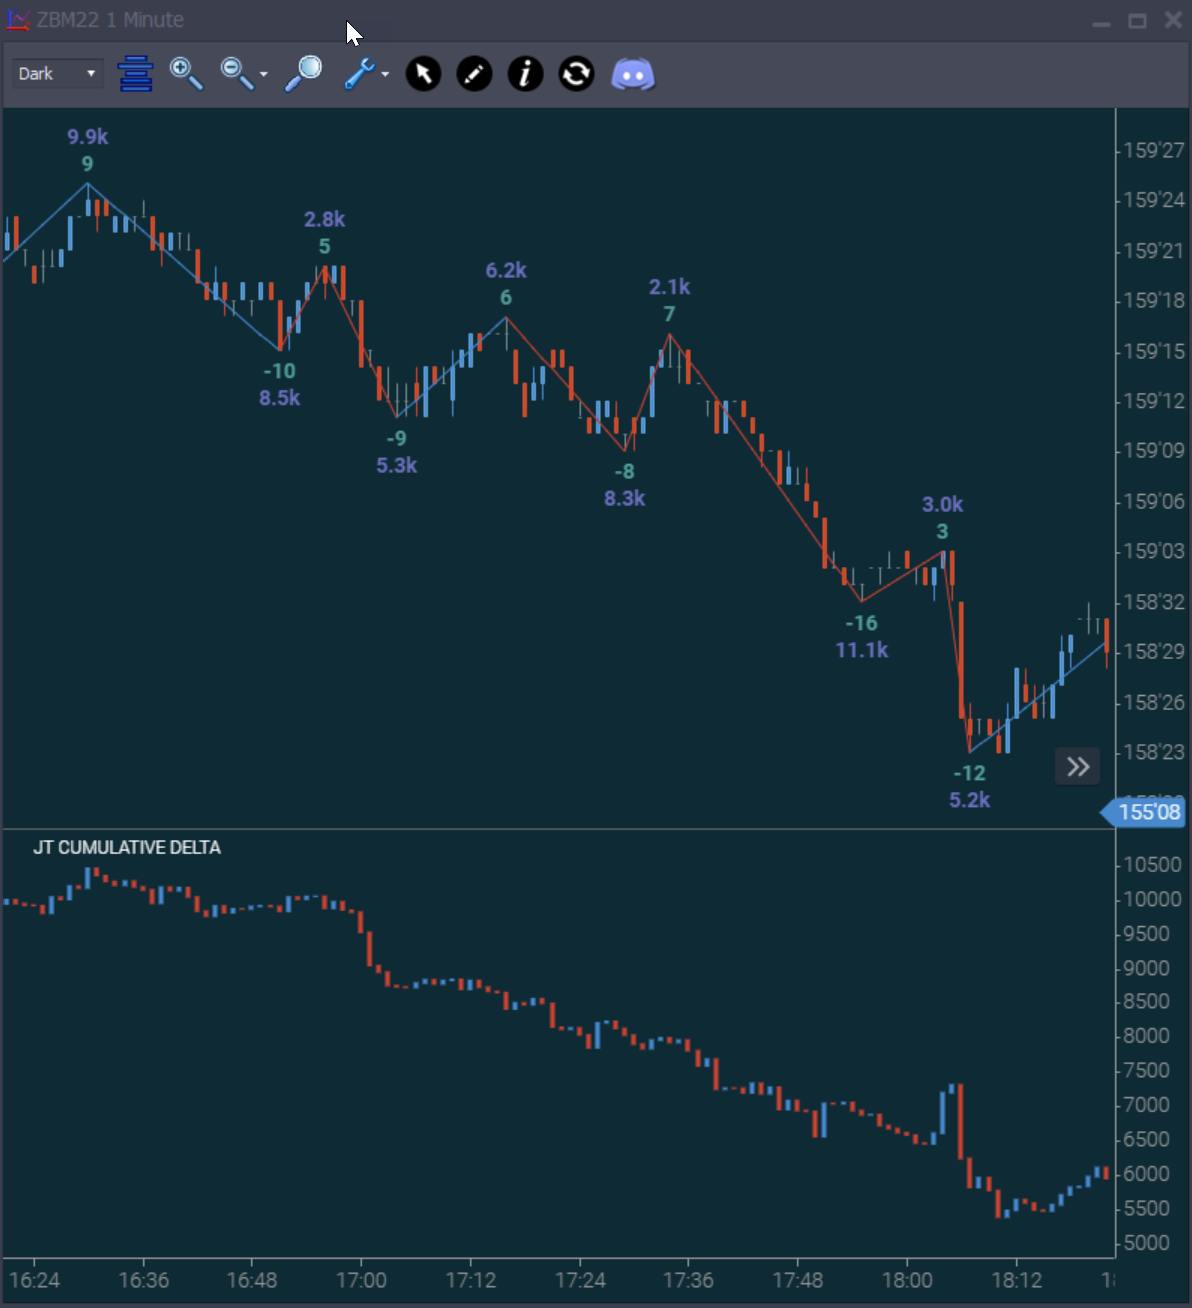
Image 2 – Market moving lower
If we look at what happened next, we got a push down with 8.5 thousand contracts and 10 ticks. We then pulled back 5 ticks trading 2.8 thousand contracts. You could look at this and say “the sell-side was weak; it only took 2.8 thousand contracts to move the market up 5 ticks when it took 8.5 thousand to move it down 10 ticks”. What this move up represents is simply the impact of a relative sell-side “liquidity” vacuum above us. Real offers took time to come into the market and provide resistance in the wake of the move down.
This is also reflected in the change in the delta on the pullbacks. As the market pulls back, the delta shift is insignificant. This reflects the fact that we aren’t consuming significant liquidity during the moves up. It’s simply a lack of liquidity.
We can see much more participation to the downside in terms of contracts traded. The delta is confirming that by showing that the mix of market orders (that consume liquidity) is biased to the downside.
Assessing the participation in a move gives you an edge over those just looking at the prices. Volume per swing is a simple and effective way to study participation. The delta studies help you understand the pace of liquidity consumption and understand whether a move is down to passive lack of liquidity or aggressive consumption of liquidity.
Simplify Your Trading
Take a look into the decision making process of professional traders with this video training series that helps you make smarter trading decisions.

0 Comments